KALIFX MT5 METRICS TOOL
KALIFX MT5 Metrics – User Instructions
The KALIFX MT5 Metrics Tool connects to your MetaTrader 5 terminal and automatically generates a detailed HTML report covering your last 30 days of trading. It calculates key metrics such as net profit, win rate, drawdown, and trade expectancy — all derived directly from your live or demo account data with no manual balance entry required. The report includes an interactive equity curve, a day-by-day calendar performance grid, weekday profit/loss analysis, a risk/reward doughnut chart, and a breakdown of your most recent trades. The tool works with live accounts and demo accounts, updating automatically so your report always reflects your latest closed trades.
What You Need
- MetaTrader 5 (MT5) installed
- A demo or live trading account
- KALIFX MT5 Metrics Tool
- MT5 running and logged into your account
How to Use – Step by Step
- Launch MetaTrader 5 and ensure you are logged into your trading account.
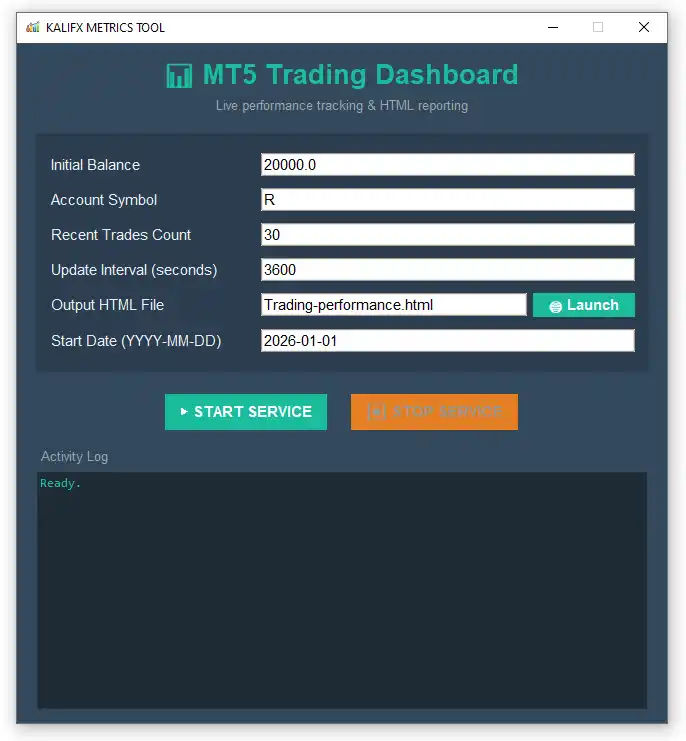
- Open the KALIFX MT5 Metrics Tool Python application.
- Fill in the configuration fields in the GUI:
- Account Symbol: Currency symbol for display (e.g., $ or R).
- Recent Trades: Number of recent trades to show in the report.
- Output HTML File: Name and location of the generated report file.
- Click ▶ START to connect the tool to MT5 and begin data collection.
- The tool will automatically fetch your account balance, pull the last 30 days of closed trades, calculate all metrics, and generate an HTML report.
- Click 🌐 Open next to the output file field to view the latest report in your browser.
- Click ⏹ STOP to safely stop the background service.
Where the Report Is Saved
By default, the report is saved as Trading-performance.html in the same
folder as the script. You can choose a custom location and file name in the
Output HTML File field. Your settings are automatically saved to
dashboard_config.json so they persist between sessions.
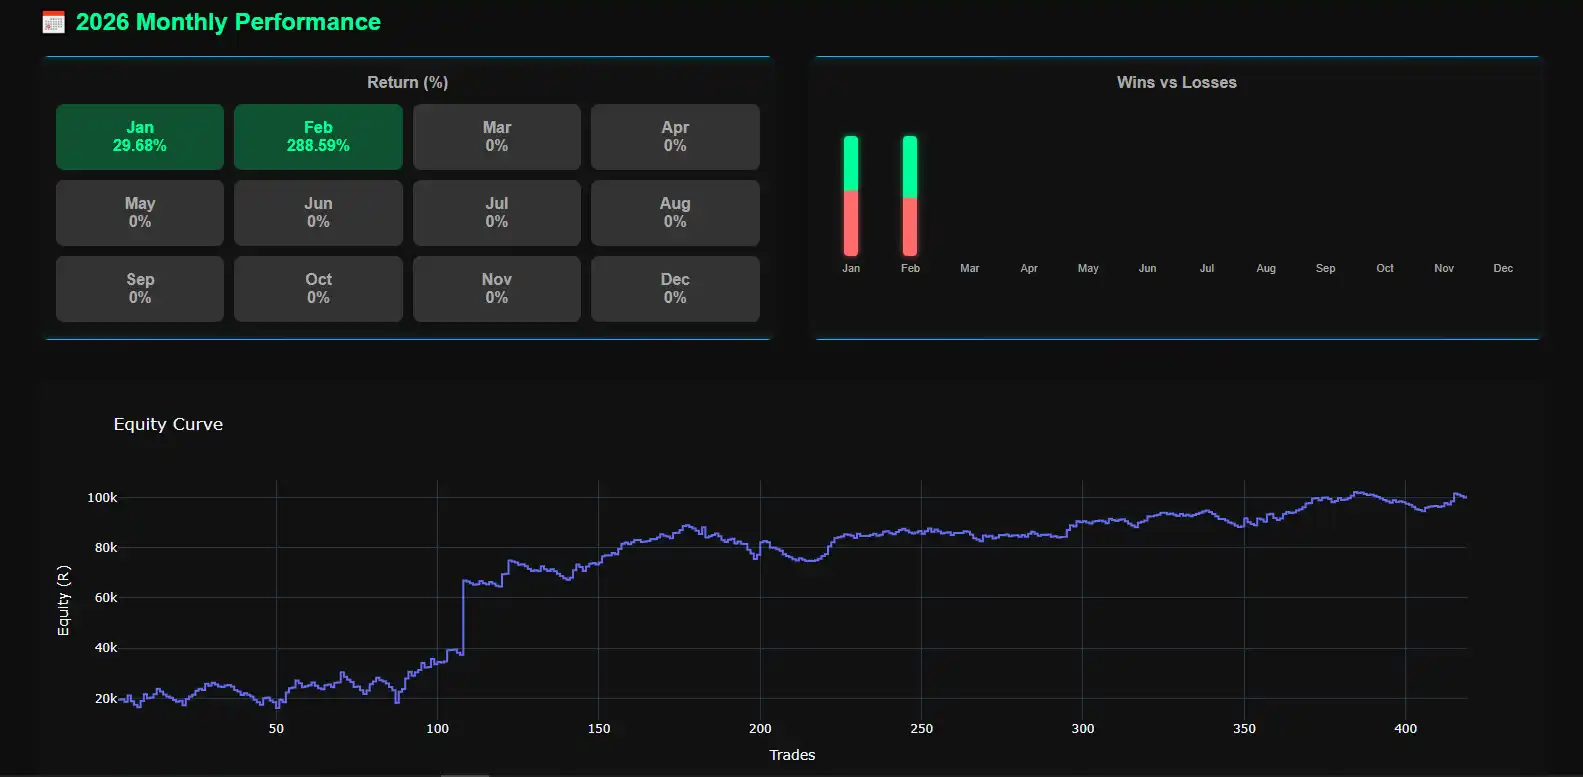
Report Contents
- Interactive equity curve chart for the last 30 days
- Net profit, floating P/L, and live account balance overview (auto-fetched from MT5)
- Win rate, profit factor, expectancy, and win/loss streak analysis
- Risk/reward doughnut chart showing gross profit vs gross loss split
- Commission breakdown — total, per-trade average, and per-lot average
- Day-by-day calendar performance grid with % gain/loss per trading day
- Weekday profit/loss bar chart (Mon–Fri breakdown)
- Recent trades table from the last 30 days
- Largest win, largest loss, average win, and average loss
- Max drawdown tracking across the period
Important Notes
- Ensure MT5 is running and logged into the correct account before clicking START.
- The report always covers the last 30 days — no period selection is required.
- Your initial balance is read directly from your MT5 account; no manual entry is needed.
- Only closed trades are included; open positions are not reflected in the report.
- Trade history is fetched in chunks for stability — large histories load reliably.
- Commission is calculated accurately by aggregating both the open and close deal legs per position.
- The report auto-refreshes in your browser so it stays current while the service is running.
- Your settings (symbol, trade count, output file) are saved automatically between sessions.
Common Use Cases
- Tracking live trading performance over the last 30 days at a glance
- Evaluating key metrics — win rate, drawdown, expectancy, and profit factor — in one report
- Identifying your strongest and weakest trading days using the daily calendar and weekday charts
- Monitoring commission costs across trades with per-trade and per-lot breakdowns
- Generating clean, shareable HTML reports for review or record keeping
- Spotting equity trends and consistency patterns over the rolling 30-day window
Need a MetaTrader 4 (MT4) version? Reach out and we’ll provide a compatible version.