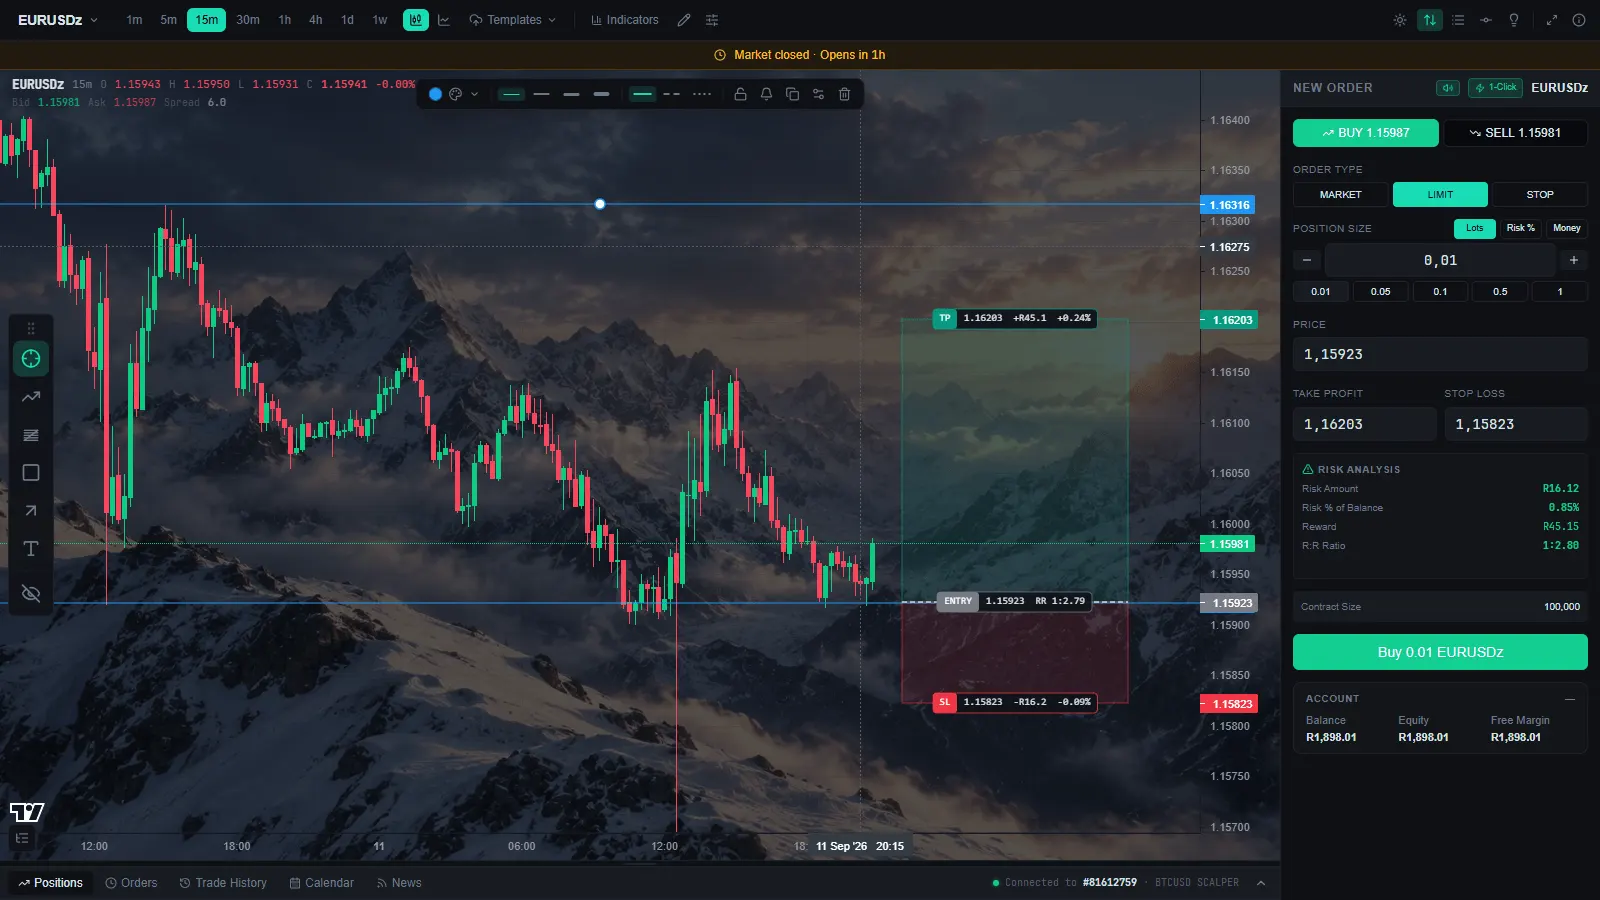
A professional Windows trading terminal built for live and demo execution. Read live market data through MetaTrader 5, analyse price action with a full suite of indicators and drawing tools, and place and manage orders — all from one fast, focused interface.
FXAxis is a desktop trading terminal that connects to your MetaTrader 5 account and puts everything you need to plan, calculate, and execute trades on one screen.
FXAxis reads live market data directly from MetaTrader 5 and renders it in a fast, professional charting workspace. You get real-time bid/ask prices, depth of market, and full order execution — market orders, pending orders, stop loss and take profit — right from the chart.
Beyond execution, FXAxis is built for preparation. Layer technical indicators, mark the chart up with a complete set of drawing tools, and preview your risk and position size before you commit. TradingView analysis widgets round out the toolkit.
FXAxis runs as a standalone Windows desktop app backed by a local Python engine. Your market data flows from your own broker connection through your machine.
A high-performance candlestick chart with bid/ask price lines, volume, crosshair, and 8 timeframes (1m to 1w). Smooth scrolling, per-symbol settings, and up to 200 bars on the chart in free mode (full history with an activation).
Connect to your MetaTrader 5 account and read live prices, symbol information, tick sizes, spread, and historical candles — streamed straight into the terminal.
Place one-click market orders, Buy/Sell Limit and Stop pending orders, set stop loss and take profit, and modify or close positions and orders from the Trading Desk.
Enter account balance, risk percent, or a fixed dollar amount, and FXAxis calculates the correct lot size from your stop-loss distance. Per-symbol pip digits and contract details built in.
SMA, EMA, RSI, MACD, Bollinger Bands, ATR, Stochastic, and VWAP — each with adjustable parameters, colors, and line settings, rendered in the correct pane.
Trendlines, horizontal/vertical lines, rays, rectangles, channels, Fibonacci retracement & extension, ellipses, arrows, triangles, text, and long/short position setups with R:R preview.
A bid/ask depth ladder alongside your chart, showing price levels around the current market for the selected symbol.
Toggle dark/light themes, customise candle colors, grid, crosshair, and drawing appearance, then save and load full chart templates with your indicators and plugins.
Keep headlines and high-impact events in view with an integrated news feed and a TradingView economic calendar.
Follow these steps to get FXAxis up and trading with your MetaTrader 5 account.
Double-click the FXAxis executable (.exe) to launch the terminal. It boots straight into the trading workspace and connects to the local market-data engine.
Log in with your MT5 account (live or demo). FXAxis reads live market data, symbols, and your account details from the broker connection. Everything runs through your local Python engine on port 8000.
Use the symbol selector in the toolbar to search and choose a market, then switch between 1m, 5m, 15m, 30m, 1h, 4h, 1d, or 1w timeframes. Your chosen timeframe is remembered per symbol.
Add indicators like SMA, EMA, RSI, MACD, Bollinger Bands, ATR, Stochastic, or VWAP from the Indicators menu. Mark the chart up with trendlines, Fibonacci, channels, rectangles, and more from the Drawing Tools. Toggle chart plugins such as session highlighting and the OHLCV tooltip.
In the Order Panel, set your account balance, risk percent, or a fixed risk amount. Draw a Long or Short position setup on the chart, and FXAxis calculates your lot size and R:R before you execute. Verify per-symbol pip digits and contract details.
Place a market order, or set Buy/Sell Limit and Stop pending orders. Adjust stop loss and take profit directly from the chart or the Trading Desk. Monitor open positions and orders, and modify or close them at any time.
Use the Depth of Market panel to see price levels around the market, keep an eye on the news and economic calendar, and review your trade history and performance.
FXAxis includes a full set of charting tools accessible from the toolbar, with appearance controls available from the settings button beside the theme toggle.
Draw a diagonal line between any two price points to mark support, resistance, or trend direction.
Place a full-width horizontal price level across the entire chart for key support/resistance zones.
Anchor a vertical time marker at a specific bar to flag an event or a decision point.
Draw a one-directional ray from a price point that extends forward in time indefinitely.
Highlight any price range and time period with a shaded rectangular zone for supply/demand areas.
Set a start point and end point, then let FXAxis automatically draw the standard Fibonacci retracement levels between them.
Draw an offset channel line parallel to a trendline to frame channels and price corridors.
Project Fibonacci extension levels beyond a completed swing for target zones and profit goals.
Add labels and notes anywhere on the chart with adjustable font size, weight, and background.
Draw a long trade setup with entry, stop loss, and take profit levels. Previews R:R and lot size before execution.
Draw a short trade setup with entry, stop loss, and take profit levels. Previews R:R and lot size before execution.
Remove all drawings from the chart in one click, or select individual drawings and delete them with the trash button.
FXAxis trades whatever your MetaTrader 5 broker exposes — from forex majors to indices, metals, energies, and crypto.
| Specification | Details |
|---|---|
| Timeframes | 1m, 5m, 15m, 30m, 1h, 4h, 1d, 1w |
| Data Source | MetaTrader 5 — live prices, history, and account data via local Python engine |
| Indicators | SMA, EMA, RSI, MACD, Bollinger Bands, ATR, Stochastic, VWAP |
| Order Types | Market Order, Buy Limit, Sell Limit, Buy Stop, Sell Stop (with SL/TP) |
| Position Sizing | Fixed lot, risk % of account, or fixed dollar amount (auto lot from SL distance) |
| Free Mode | Charts limited to 200 bars |
| Activated | Full bar history unlocked on every timeframe |
| Platform | Windows desktop app (Electron) with in-app trading terminal |
| Extras | Depth of Market, TradingView analysis, news feed & economic calendar |
FXAxis requires MetaTrader 5 to be installed on the same machine
FXAxis streams live market data and historical candles through a local engine, so available memory and a stable network connection are the main considerations. Ensure MetaTrader 5 is installed and logged in on the same machine, and that you have sufficient free RAM for larger charts and longer histories. The minimum specs above are a baseline; more RAM and a faster CPU give you smoother scrolling and faster indicator calculations on large datasets.
Download FXAxis for Windows. Connect your MT5 account, plan your setup, and execute with confidence.
Experience the full FXAxis terminal at no cost. Just download, connect your MT5 account, and start planning, calculating, and executing your trades.
Full version unlocks unlimited chart history