A lightweight offline trading simulator built for learning and practice. Load historical CSV data, replay markets step by step, and apply simple risk management — ideal for beginners learning forex, while still useful for experienced traders refining their strategies.
ChartScope is a fully offline trading simulator built for traders who want to test and refine their strategies without risking real capital.
ChartScope lets you load any historical market data in CSV format and replay it candle by candle — exactly as if the market were unfolding in real time. You can place long and short trades, set stop losses and take profits, and track your performance across an entire backtesting session.
Unlike paper trading on live platforms, ChartScope gives you full control over time: pause, rewind, fast-forward. You can test weeks of market history in minutes. Every session is saved and reloadable so you can pick up right where you left off.
ChartScope runs as a standalone Windows desktop app. Your data never leaves your machine.
Import historical OHLCV data from any broker or data provider. Supports multiple CSV formats with automatic column detection for date, time, open, high, low, close, and volume.
Replay markets bar by bar or tick by tick. Navigate forward, backward, or jump to any position with the progress slider. Adjustable speed from 1× to 50× for rapid review.
Switch between 1m, 5m, 15m, 1H, 4H, 1D, and 1W timeframes on the fly. ChartScope aggregates your raw data automatically — no need to import separate files per timeframe.
Volume bars are rendered below the candlestick chart in real time during replay, giving you the complete picture of market participation alongside price action.
Draw Long or Short R:R setups directly on the chart. ChartScope calculates your lot size, risk amount, reward amount, and R:R ratio automatically before you execute.
Place instant market orders or set pending orders (Buy/Sell Limit and Stop). Pending orders trigger automatically when price reaches your level during replay.
Track your balance, equity, realized P&L, unrealized P&L, win rate, and total trade count in a live Trading Desk panel. All stats update in real time as bars progress.
Set your account balance and risk percentage. ChartScope automatically calculates the correct lot size for every trade based on your stop loss distance — no manual math needed.
Save your entire simulation — trades, drawings, replay position, and account state — to a JSON file and restore it later to continue exactly where you left off.
Mark up the chart with trendlines, horizontal lines, rays, rectangles, and Fibonacci retracements. Drawings persist across the session and can be individually selected, adjusted, or deleted.
A full log of every trade — open, pending, closed wins, closed losses, and canceled orders — with entry price, exit price, P&L, and timestamps.
Toggle between dark and light mode, then use the chart settings button beside the theme switch to tune drawing colors, line thickness, candle colors, and grid visibility/opacity.
Follow these steps to run your first backtesting simulation in ChartScope.
Double-click the ChartScope executable (.exe) to launch the app. Everything runs locally on your machine.
Click the Load Data button in the top toolbar and select your CSV file. ChartScope accepts standard OHLCV CSV files exported from MetaTrader 4/5, TradingView, or any other data provider. The file is parsed locally — your data stays on your device.
In the Order Management panel (right side), set your Starting Balance, Risk % per trade, and select your Instrument type (Forex Major, Gold, NAS100, etc.). ChartScope uses this to calculate precise lot sizes. For custom instruments, enter your own Point Size and Point Value.
Use the timeframe selector in the toolbar to switch between 1m, 5m, 15m, 1H, 4H, 1D, or 1W views. ChartScope builds all timeframes from the same CSV — you can switch at any time without reloading data.
Click the gear icon beside the theme toggle to open Chart Settings. From there you can change drawing-tool colors and thickness, customize bull and bear candle colors, and control chart grid visibility and opacity before you begin your replay session.
Click Replay to reset to the beginning of your data, then use Play/Pause, ◀ Prev, and Next ▶ to control playback. Adjust the Speed slider (1×–50×) to pace the replay. Toggle between Bar and Tick mode for coarser or finer step-through.
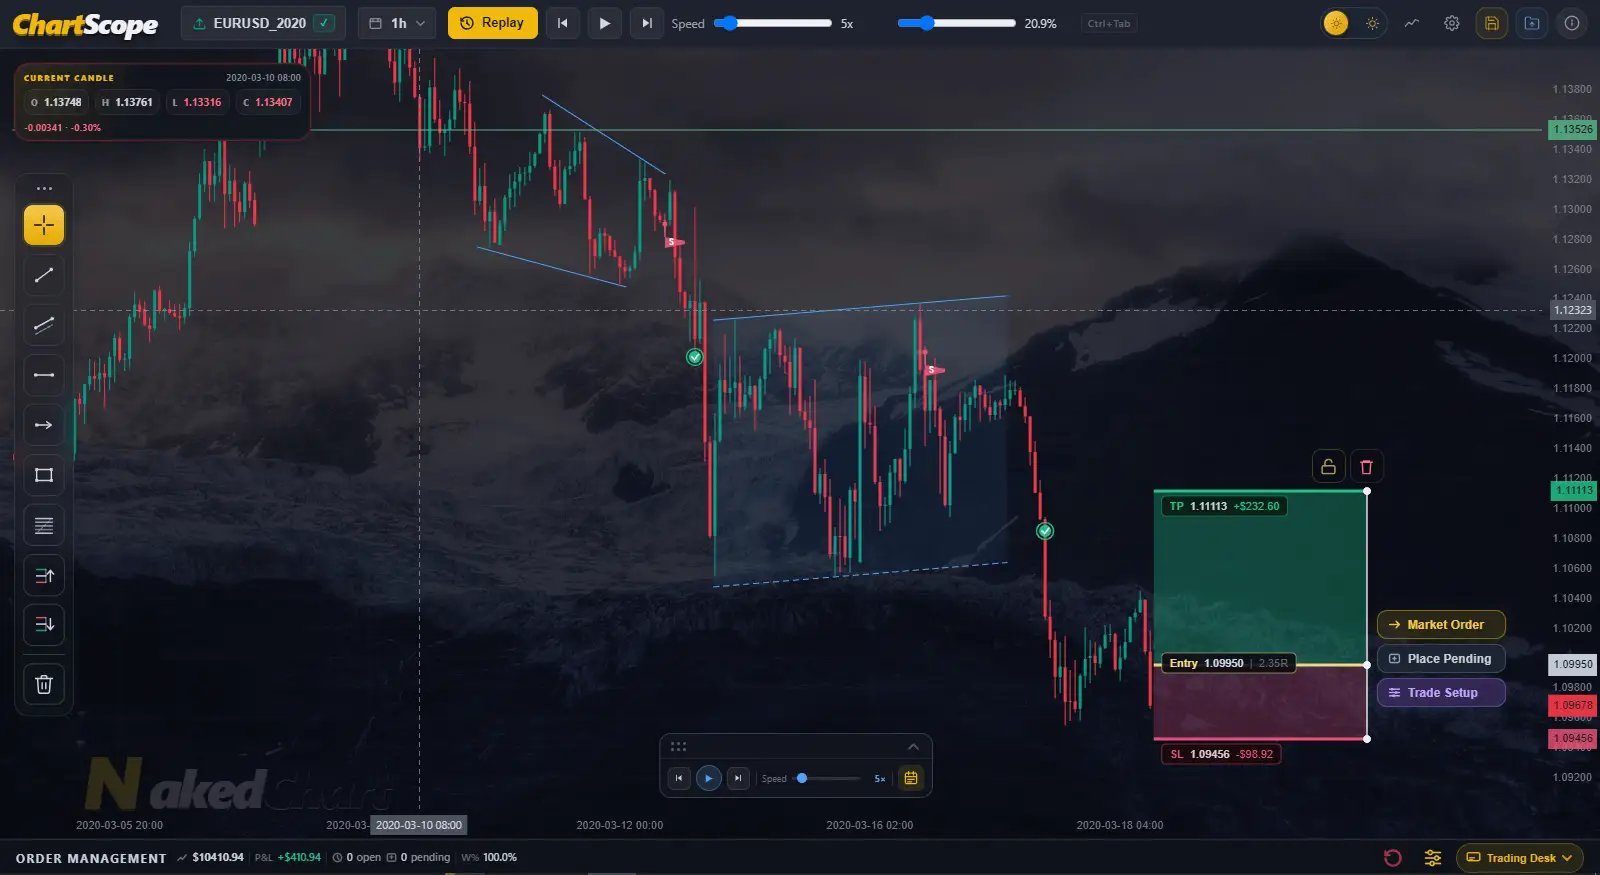
Select the Long ▲ or Short ▼ tool from the drawing toolbar (left side of the chart). Click to set your entry price, then drag to define your Stop Loss and Take Profit levels. The R:R panel updates live showing your risk/reward ratio, lot size, and dollar amounts before you commit.
With a Long/Short drawing selected, click ▶ Market Order to enter at the current price, or ⬛ Place Pending to queue an entry at your drawn level. Pending orders trigger automatically when price reaches them during replay. Monitor all open and pending orders in the Trading Desk tabs.
Check your results in the Summary tab (balance, equity, win rate, P&L). View closed trade details in the History tab. When done, click Save Session to export a JSON file capturing your full state — drawings, trades, position, and account — so you can resume later with Load Session.
ChartScope includes a full set of charting tools accessible from the left-side toolbar, with appearance controls available from the settings button beside the theme toggle.
Default cursor mode. Displays live price and time labels as you hover across the chart.
Draw a diagonal line between any two price points to mark support, resistance, or trend direction.
Place a full-width horizontal price level across the entire chart for key support/resistance zones.
Draw a one-directional ray from a price point that extends forward in time indefinitely.
Highlight any price range and time period with a shaded rectangular zone for supply/demand areas.
Set a start point and end point, then let ChartScope automatically draw the standard Fibonacci retracement levels between them.
Draw a long trade setup with entry, stop loss, and take profit levels. Previews R:R and lot size before execution.
Draw a short trade setup with entry, stop loss, and take profit levels. Previews R:R and lot size before execution.
Remove all drawings from the chart in one click, or select individual drawings and delete them with the trash button.
ChartScope supports pre-configured instrument profiles and allows fully custom setups.
| Specification | Details |
|---|---|
| Timeframes | 1m, 5m, 15m, 1H, 4H, 1D, 1W — all built from one CSV file automatically |
| Data Format | CSV with OHLCV columns. Supports MetaTrader, TradingView, and custom broker exports |
| Max Candles | Up to 75,000 bars per timeframe stored in memory (~100 MB total across all 7 timeframes) |
| Replay Modes | Bar mode (one complete candle per step) and Tick mode (finer sub-bar steps) |
| Replay Speed | 1× to 50× adjustable via slider |
| Lot Sizing | Auto mode (calculated from Risk % and stop distance) or Manual (set lots directly) |
| Order Types | Market Order, Buy Limit, Sell Limit, Buy Stop, Sell Stop (Pending Orders) |
| Session Save | Full state exported as JSON — trades, drawings, replay position, account balance |
| Platform | Windows desktop app. Fully offline — no internet required |
| Data Privacy | All data processed locally. Nothing is transmitted externally |
Minimum specs for CSV files under 2 GB
ChartScope processes all data locally, so available memory is the primary bottleneck. If you are working with large CSV files — particularly those exceeding 5 GB — make sure your system has sufficient free RAM before loading them, as your OS needs headroom to operate alongside the app. The minimum specs above are a baseline; more RAM and a faster CPU allow you to load significantly larger datasets with better responsiveness and no slowdowns.
Download ChartScope for Windows. Launch it, load your CSV, and start trading the past to master the future.
Experience the full feature set of ChartScope at no cost. Just download, load your data, and start practising.
Full version includes lifetime access